52°North Helgoland Client
The 52°North Helgoland Client is a lightweight web application that enables the exploration, visualization and analysis of sensor web data in various fields of use, e.g. hydrology, meteorology, environmental monitoring, traffic management. This tutorial shows you how to use the Helgoland Client. In this tutorial we use as an example the 52°North SOS which was installed in the SOS Installation War File tutorial and we use the data which was added to the SOS in the SOS Example Request tutorial. But you can also follow along the tutorial with different data.
Workflow
The workflow would be:
- Open Helgoland Client
- Explore Sensor Web Data on Map
- Select Timeseries by Map
- Visualize Timeseries in Diagram
Open Helgoland Client
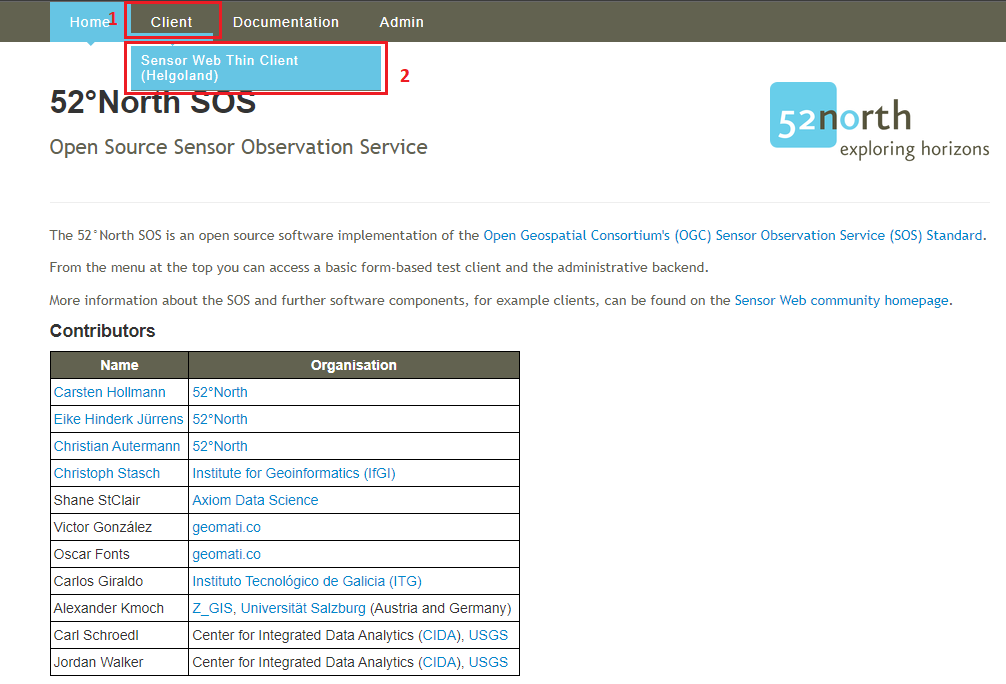
The 52°North Helgoland Client is part of the 52°North SOS installation. This means that we have already successfully installed Helgoland with the SOS. You can access the Helgoland Client from the SOS menu.
# Activity 1
- Hover your mouse over
Client- Click
Sensor Web Thin Client (Helgoland)in the drop down menu
Explore Sensor Web Data on Map
When you open the Helgoland Client you come to the Diagram view. Because you opened the
Helgoland Client for the first time you have no data selected to be shown in the Diagram.
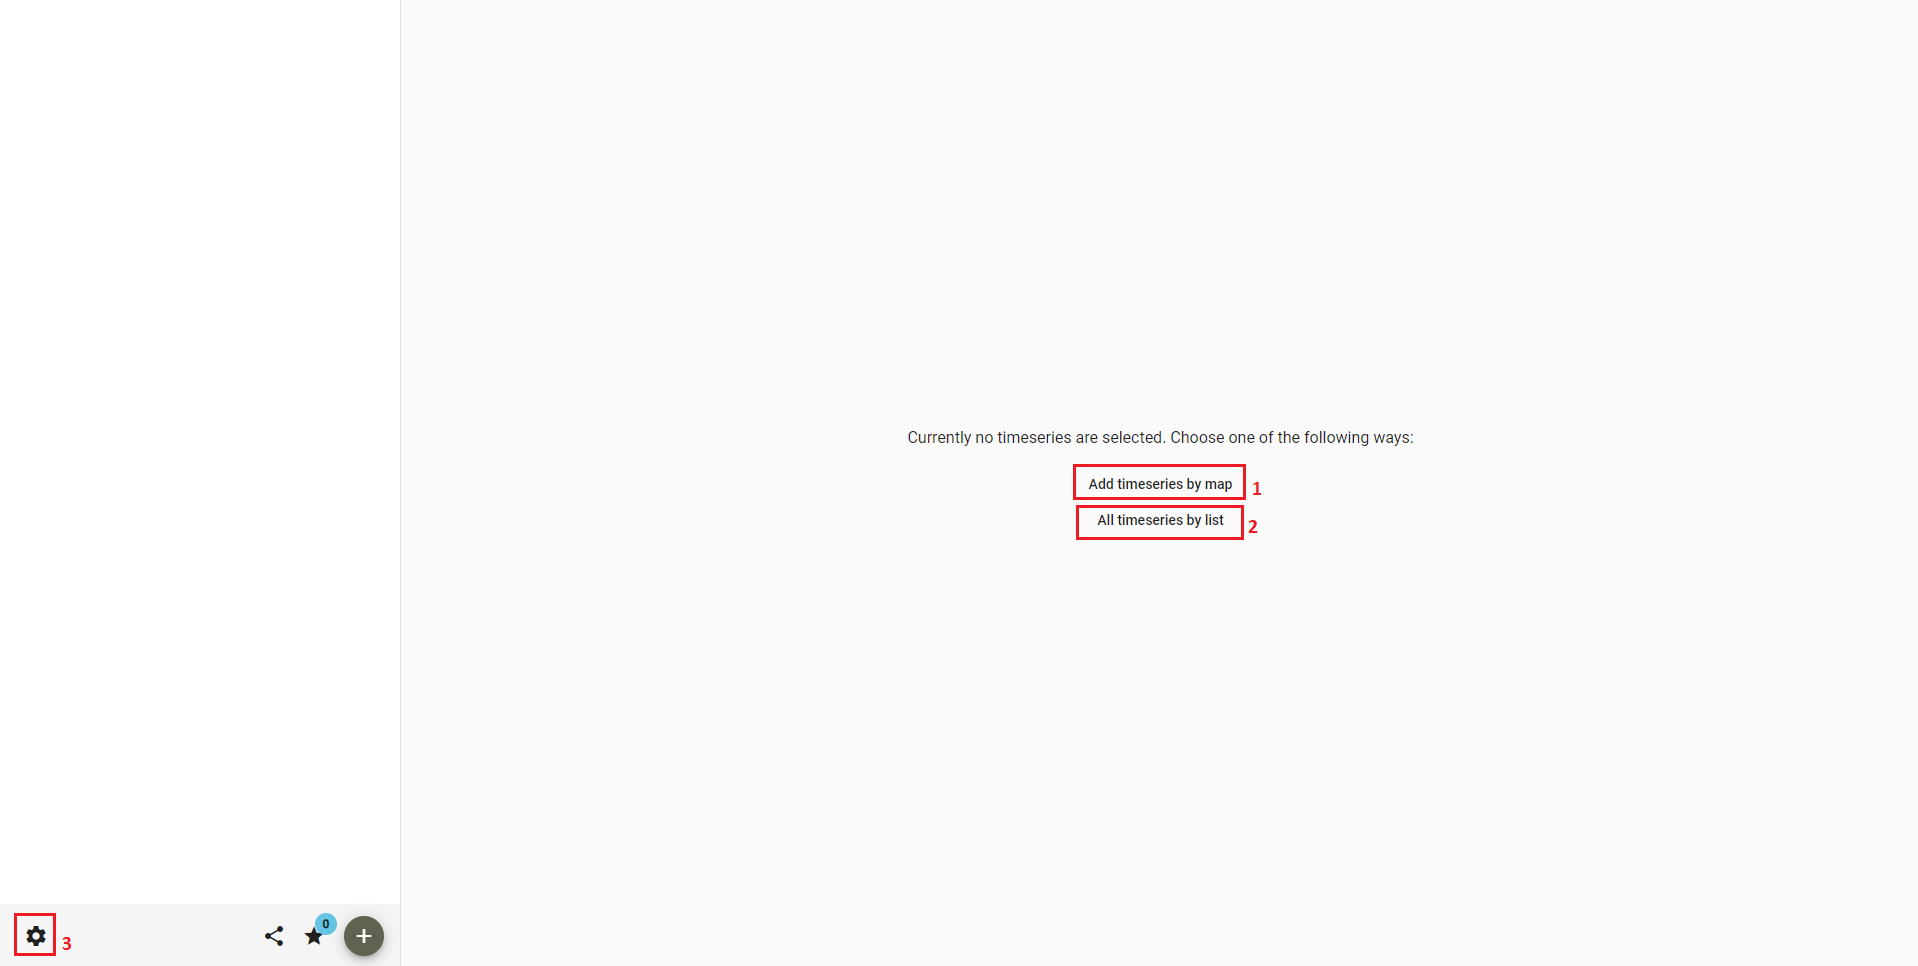
- Here you can choose timeseries in the
Mapview to be shown in theDiagram - Here you can choose timeseries in the
Listview to be shown in theDiagram - Here you can change the view to a
Darkmodeor adjust theLanguage(currently supported languages are English and German)
# Activity 2
- Select your language
- Click on
Add timeseries by map
Now you can explore all the measurement stations, which are provided by the service. In this example
it is only on station, which measures the air temperature. If you start the Helgoland Client for the
first time, you have to select a provider before you can see the Map.
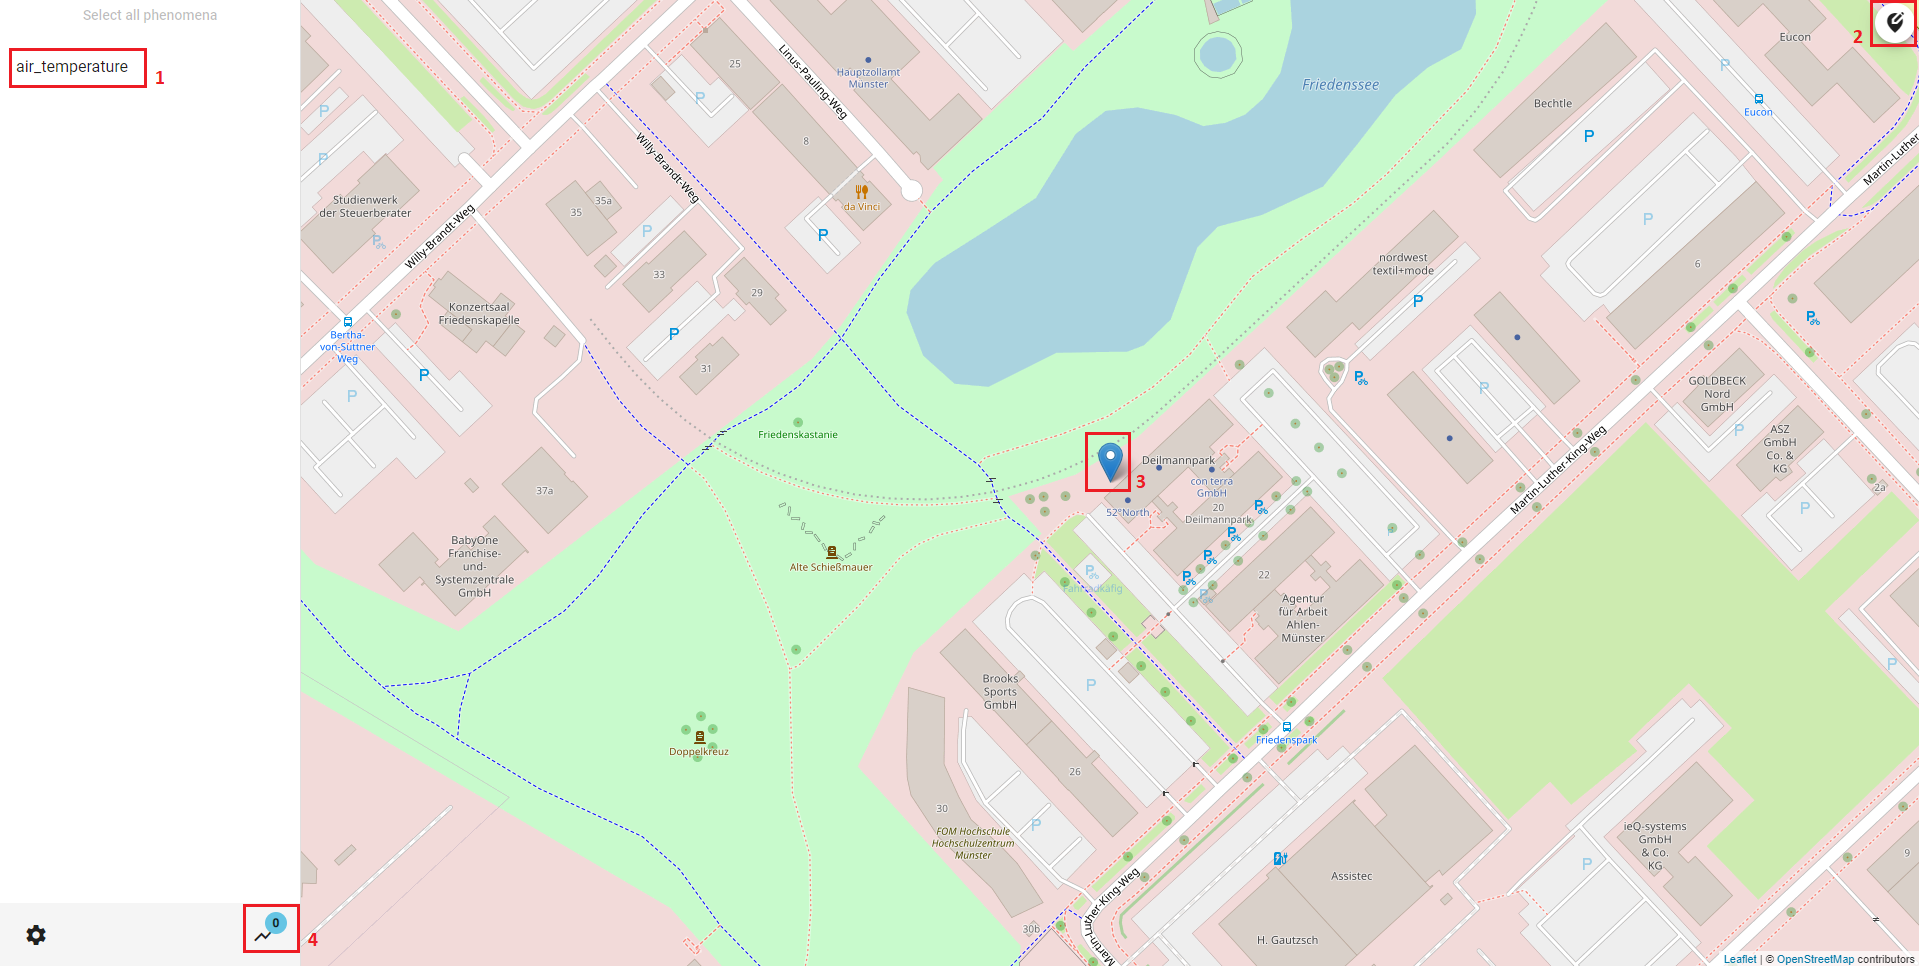
- Select a phenomenon to filter which stations are displayed in the
Map - Here you can adjust the provider
- This symbol marks a measurment station
- Here you can navigate back to the
Diagramview
If you have chosen a station, which timeseries data you want to present in the Diagram, you can select it
by clicking on it.
# Activity 3
- Select the station by clicking on the symbol in the
Map
Select Timeseries by Map
After you clicked on a station a popup opens. In this you can select timeseries.
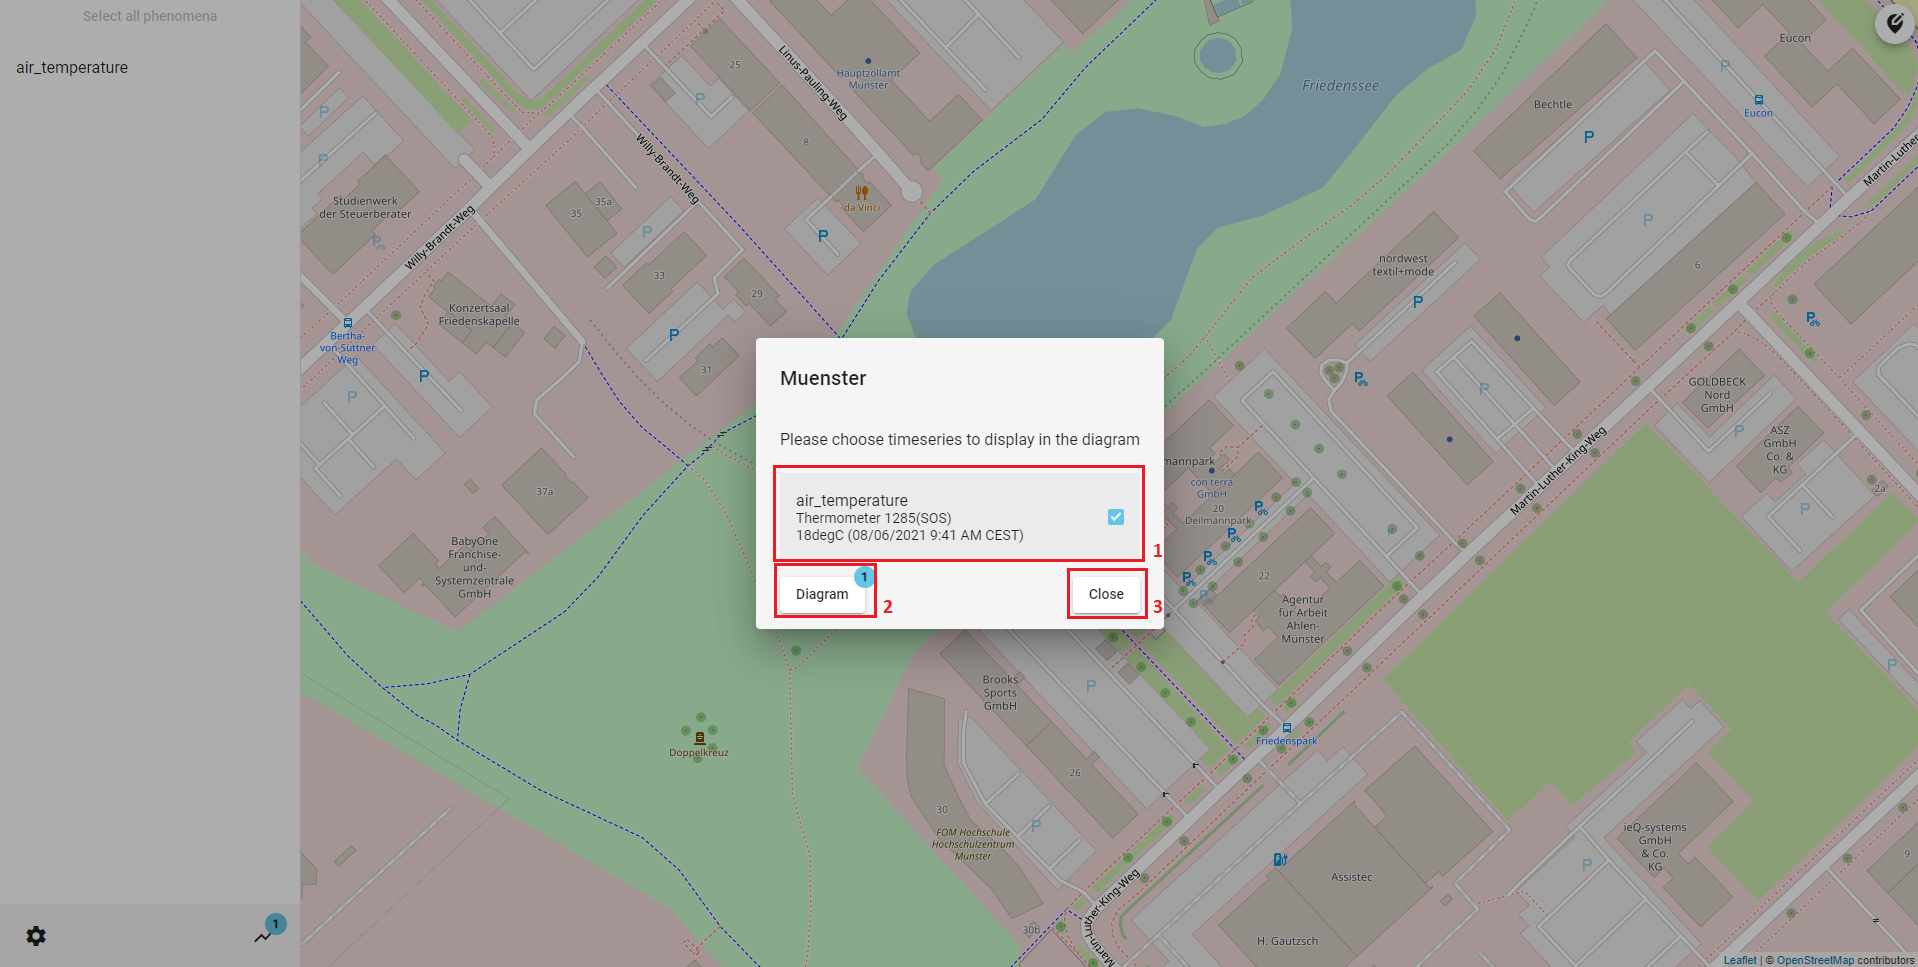
- By clicking on the timeseries you select it for the
Diagram - Here you can navigate back to the
Diagramview - Click here to close the popup to choose data from different stations
# Activity 4
- Select timeseries data
- Click on
Diagram
Visualize Timeseries in Diagram
Now the Diagram displays your chosen timeseries. You can visualize the data or add more timeseries.
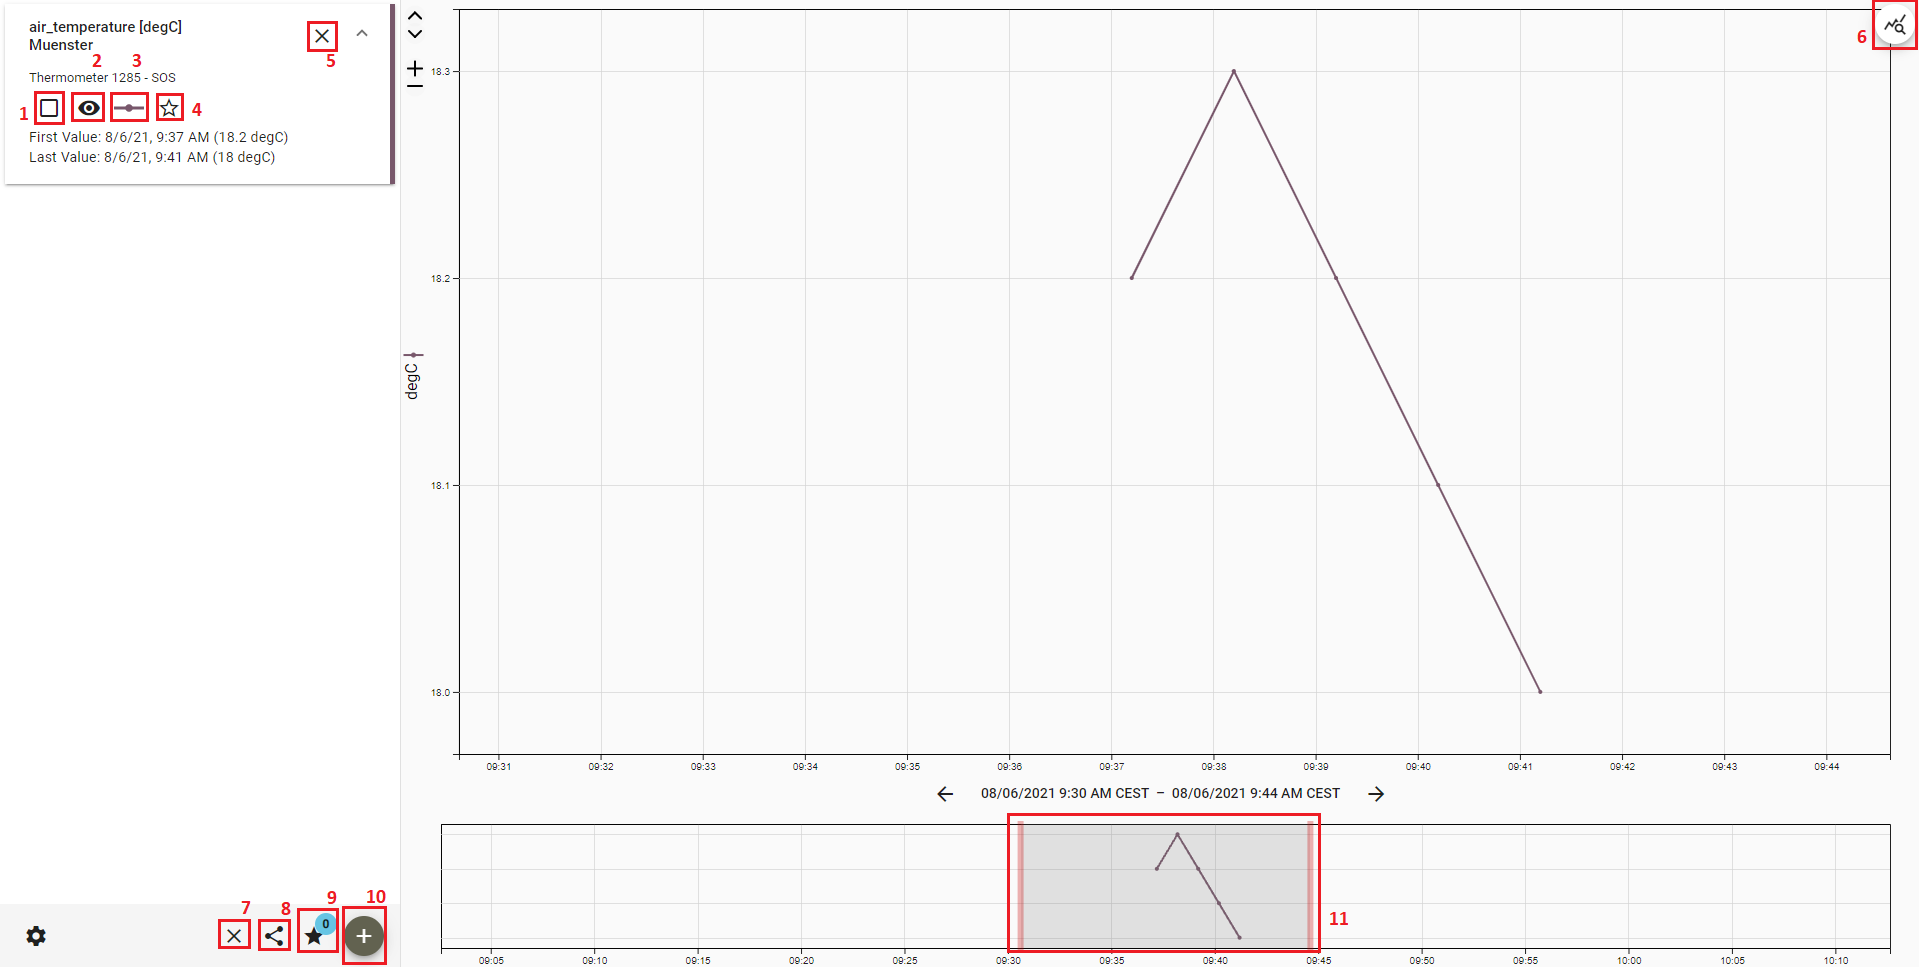
- By clicking here you can highlight the timeseries
- Here you can enable or disable the visibility of the data in the
Diagram. - Here you can style the timeseries
- By clicking on the star you can add the timeseries to your
Favorites. - Here you can delete the timeseries from the
Diagram. - Here you can configurate the
Diagramsettings - This button clears all data from the
Diagram. - Here you can save a link to you clipboard to share your
Diagram - Here you can see your saved
Favorites - By clicking on the
Plusyou can add more timeseries to theDiagram - By moving the red window or the edges of the window you can adjust the displayed period of time.
# Activity 5
- Try the different options and find the best way to visualize your data
Select Timeseries by List
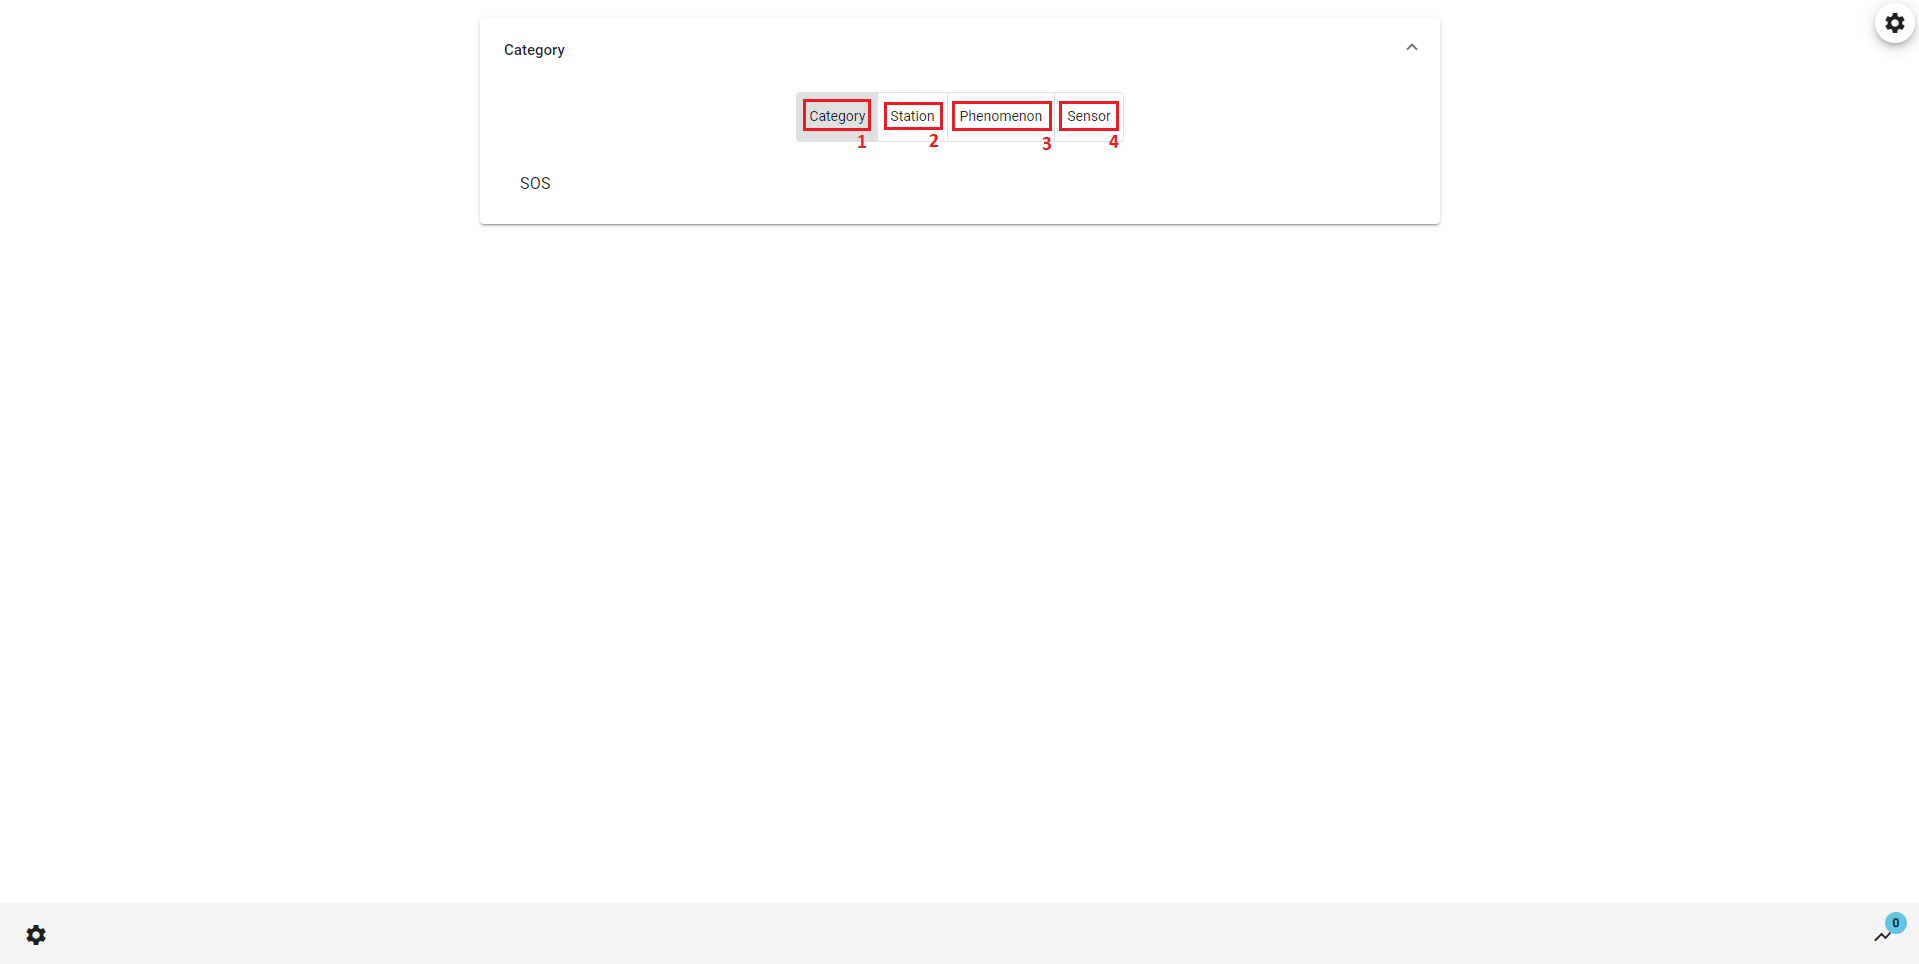
Alternativ to the Map view you can use the List view to add new timeseries to the Diagram. In the
List view you can filter by four filter options (Category, Station, Phenomenon and Sensor).
Select a filter option and then select an item you want to filter by from the List below.
# Activity 6
- Choose a filter option
- Select an item from the list below to filter by
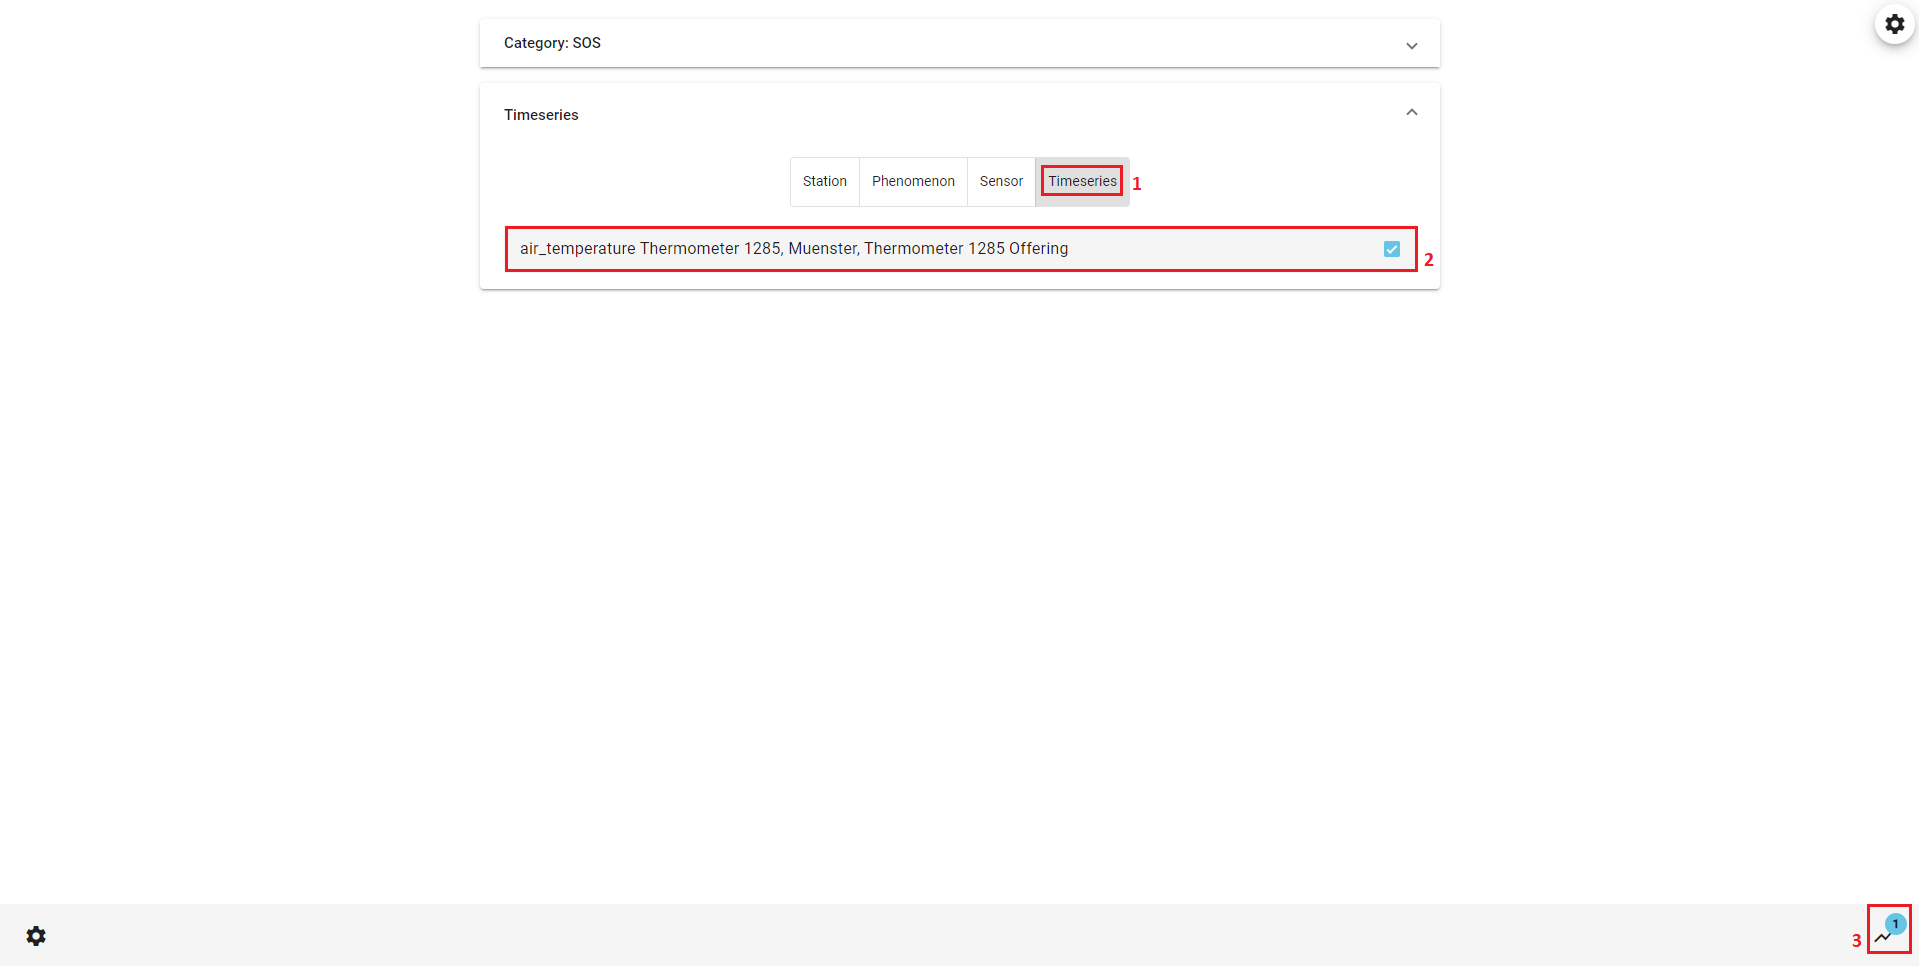
When you have selected at least one filter you can click on Timeseries. There you can select timeseries
for the Diagram.
# Activity 7
- Click on
Timeseries- Select a timeseries
- Click on the diagram symbol to navigate back to the
Diagram
Now you successfully learnt how to use the 52°North Helgoland Client and can explore, visualize and analyse your sensor web data.